Oftentimes, we get so caught up in perfecting how our website looks and the content it contains that we forget about one factor that can seriously make or break our chances of getting the traffic that we want: web page loading speed.
But what makes web page loading speed so important? How does it affect the amount of traffic that your website gets? Let’s take a look at some statistics.
Numerous studies show that 47% of internet users expect a website page to load within 2 seconds or less. If your website pages take longer than 2 seconds to load, you will lose a large portion of your website visitors.
The worst part? 80% of those people will not return to your website.
However, your website’s loading speed on desktops isn’t the only thing you should be concerned about. Have you checked how it performs on mobile?
With mobile devices making up over 51% of global website traffic, speeding up your mobile site’s loading speed is becoming more and more of a priority.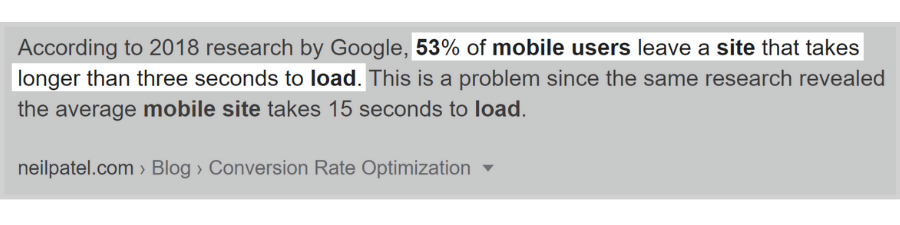 So how do you find out whether or not your website is performing well?
Do you just go to your website and see how fast your pages load? Sure, you can do that.
But, you won’t be able to obtain the information you need to spot and remedy the issues that are causing your website loading speed to plummet.
Luckily, Google has a free tool that lets you do exactly that! It’s called Google PageSpeed Insights.
What Does Google PageSpeed Insights Do?
Google PageSpeed Insights is a free online tool that lets you measure the loading speed of your website pages both on desktop and mobile devices. It detects the issues that are causing your website pages to perform poorly and suggests ways to fix them.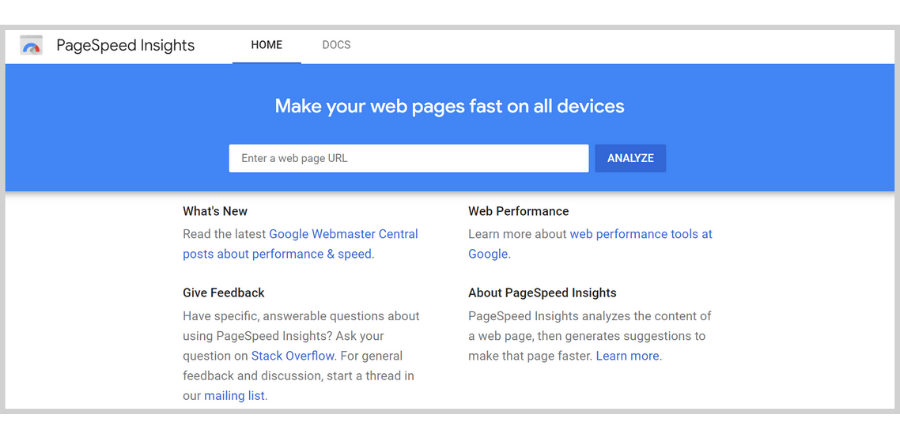
How Do You Use Google PageSpeed Insights?
Step 1: Go to the Google PageSpeed Insights website.
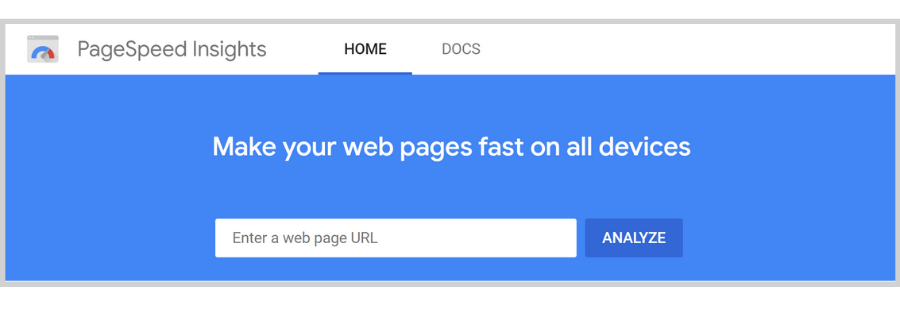
Step 2: Enter the URL of a web page.
It could be the URL of your homepage or any other web page on your website.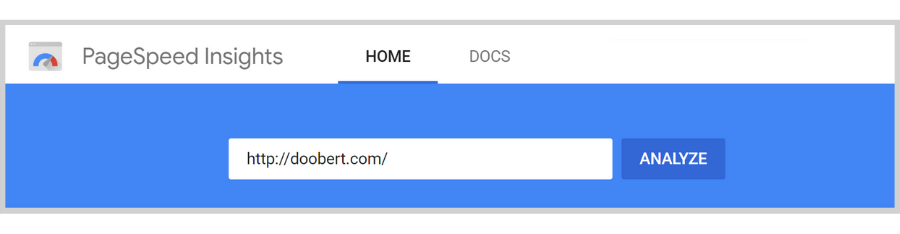
Step 3: Click the “Analyze” button.
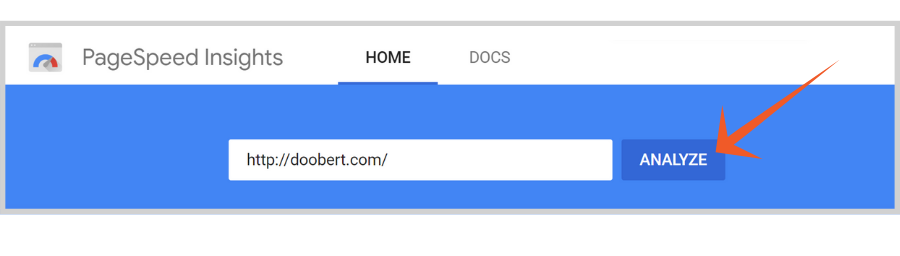
After analyzing the web page, it’ll come back with your performance scores.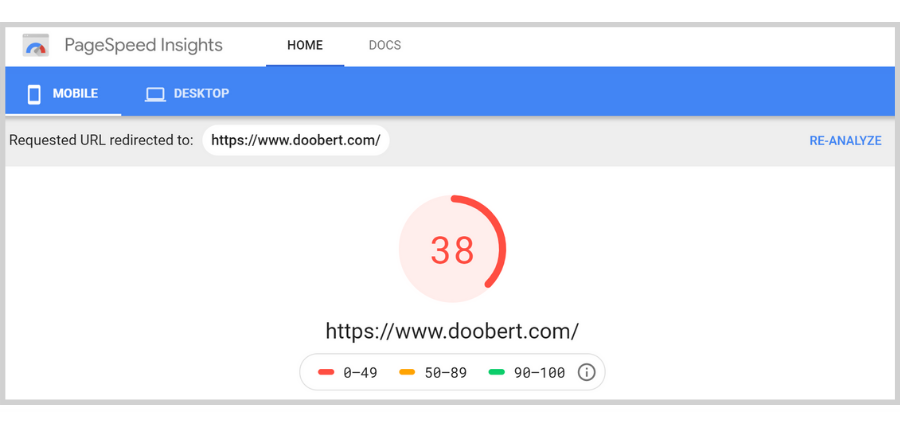
Mobile site performance is presented by default, but you can easily switch to desktop by clicking on the “Desktop” tab at the upper left-hand side of the page.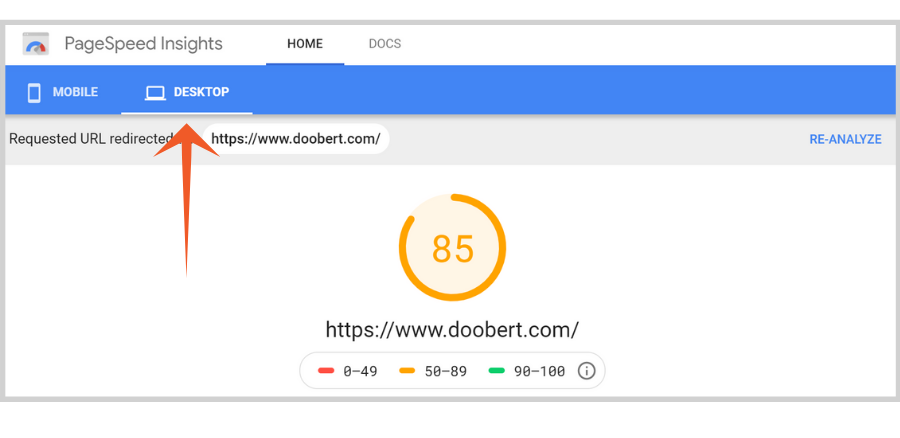
What Data Does Google PageSpeed Insights Present?
Google PageSpeed Insights can provide you with plenty of useful information that can help you make any necessary changes to improve your web page loading speed.
But of course, in order for you to know which areas of your web pages need work, you must know how to interpret the data being presented to you.
Here are the different types of data you’ll encounter on Google PageSpeed Insights and what each of them means:
Your Page Speed Score
Google PageSpeed Insights takes a look at how well a web page is performing and uses the data it collects to calculate a score between 0 to 100. A page speed score of 90 and above indicates that your web page is performing well and doesn’t have a lot of lag. A score between 50 to 89 shows that there’s still room for improvement. Anything below 50 means that you need to do some serious revamping.
Field Data
Field data, also known as Real User Monitoring or RUM, is gathered from the experience that your real-life visitors are having with your web page loading speed. 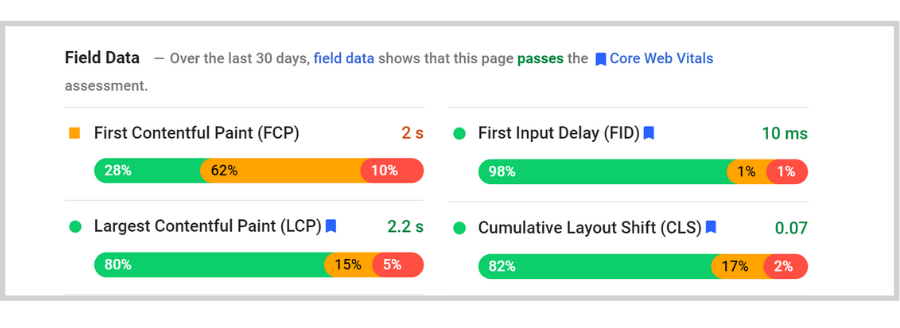
Field Data involves the following metrics:
This measures the time it takes from when the page starts to load to when any part of the web page appears.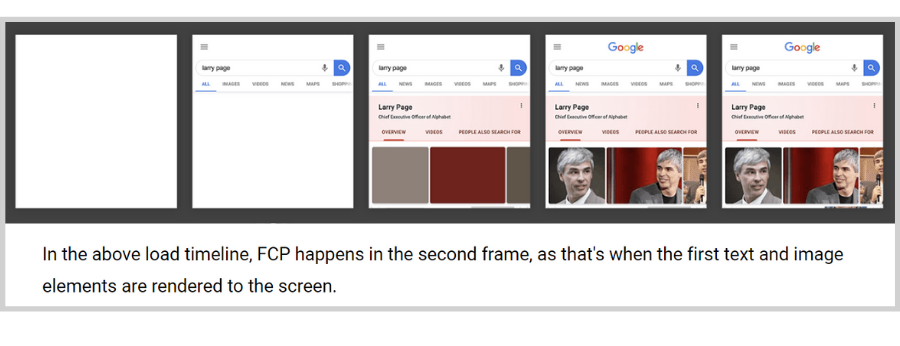
Largest Contentful Paint (LCP)
This marks the point in the web page load timeline in which the largest piece of content (image, text block, etc.) on a web page finishes loading.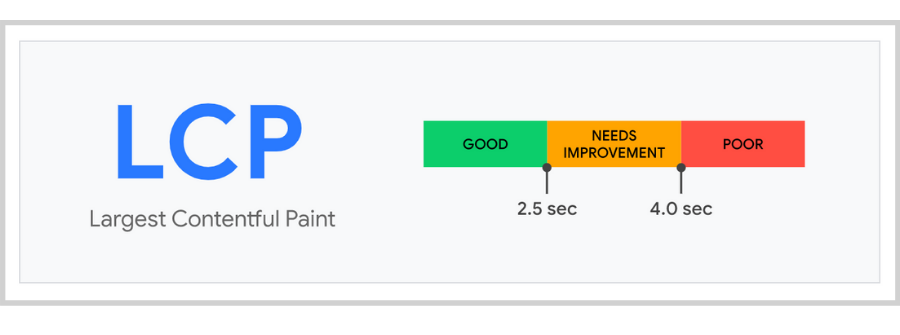
This is measures the time from when a visitor interacts with the web page to when a response is carried out. The higher the FID, the less responsive the web page is.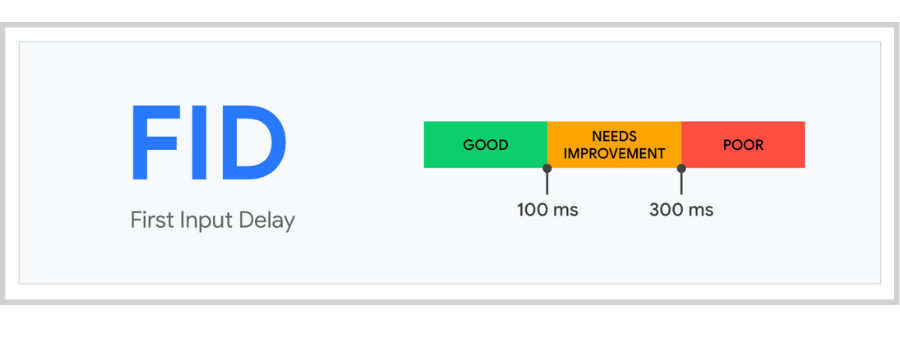
This reflects the number of times an element on a web page shifts or changes. (buttons suddenly moving, text shifting to the left, etc.)
Lab Data
Lab data is collected in a controlled environment and is meant to serve as a way to help you identify and fix the issues behind your slow-loading pages. Unlike field data, however, lab data isn’t very useful when it comes to solving the real-life bottlenecks that might be causing your website visitors to bounce.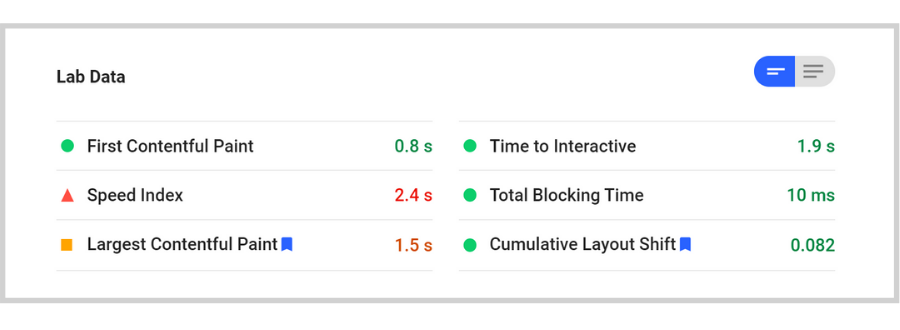
Lab Data reports on the following metrics:
(In addition to First Contentful Paint, Largest Contentful Paint, and Cumulative Layout Shift)
This measures how fast a web page visually displays content.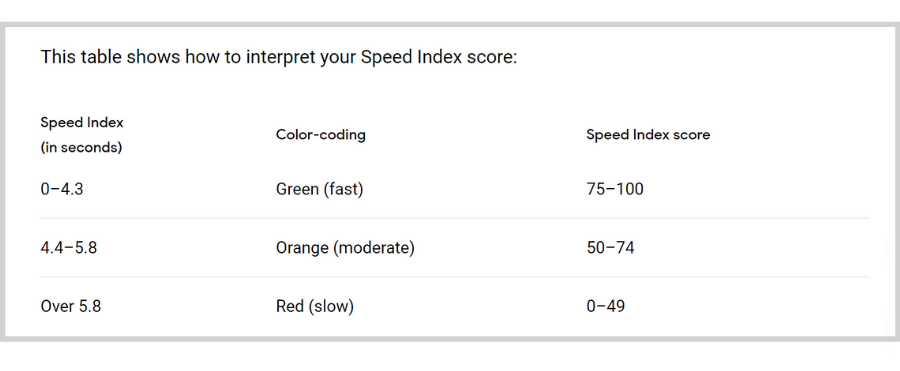
Time to Interactive (TTI)
This shows how long it takes for a web page to become fully interactive.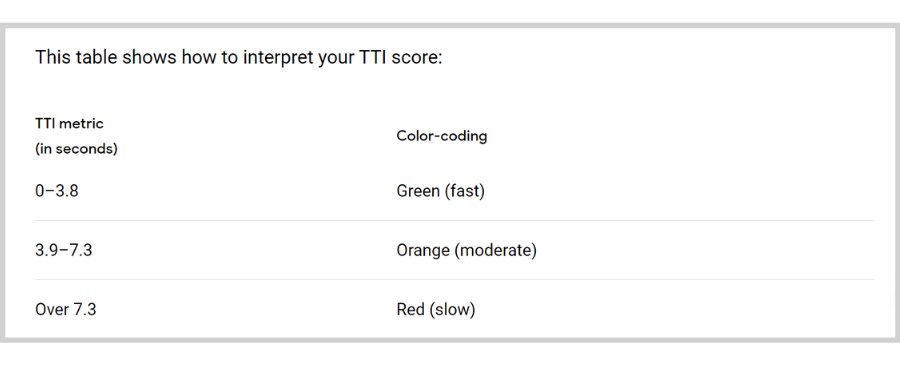
Total Blocking Time (TBT)
This is the time between First Contentful Paint and Time to Interactive. It represents the total amount of time in between several tasks where the web page is “blocked” or noninteractive as responses to a user’s interaction is being carried out.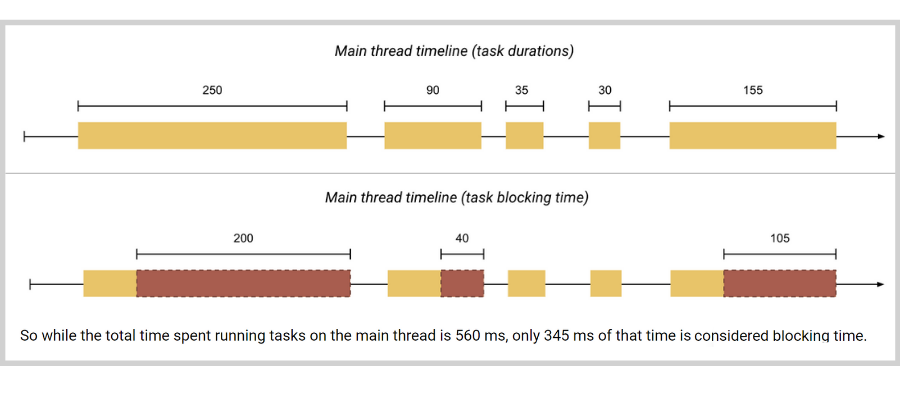
Audits
Below Lab Data, you’ll find the audits that were done to your web page together with suggestions on how to improve your page loading speed. To the right of each suggestion, you’ll find a drop-down button that you can click to view more information.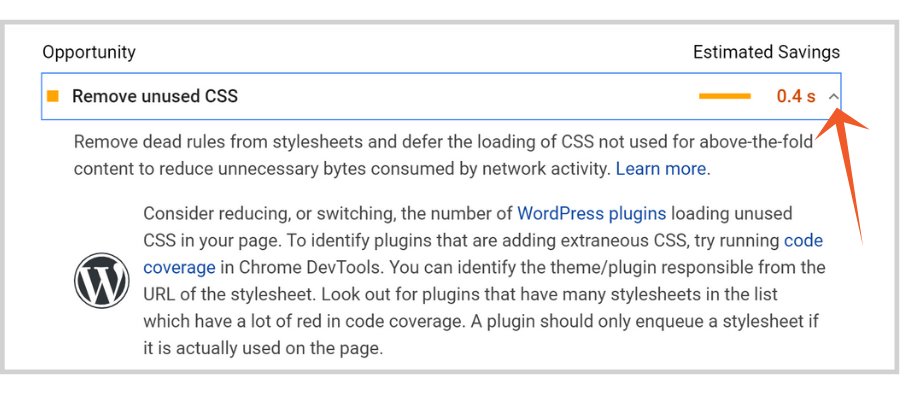
Opportunities
This is where you’ll see suggestions on how you can improve your web page loading speed.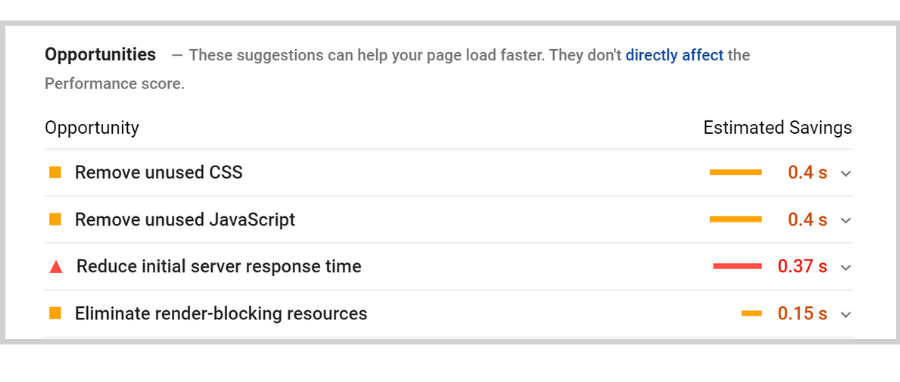
Diagnostics
This contains additional information about the performance of your web page.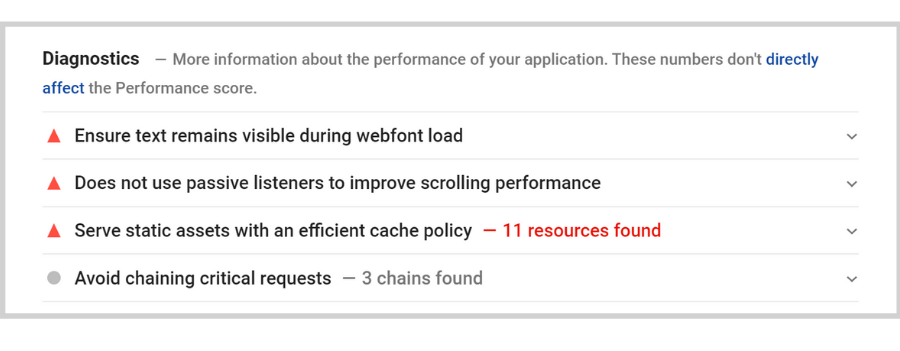
Passed Audits
These are the audits that your web page has passed.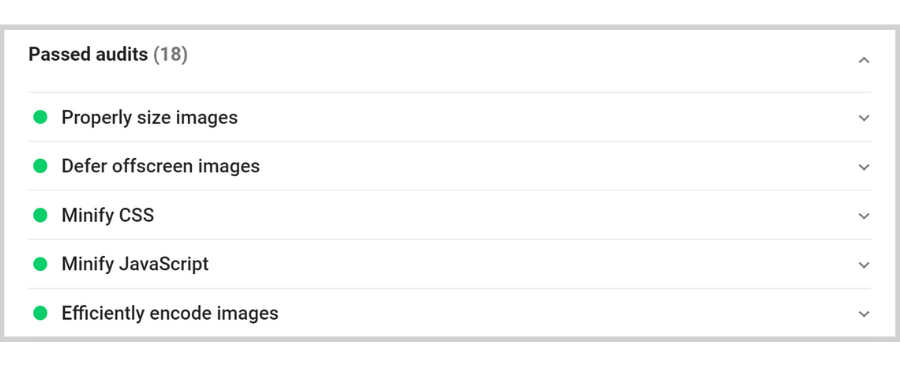
That pretty much covers the basics of Google PageSpeed Insights.
Once you’ve tested your web pages and identified which ones are performing poorly the problems causing them to do so, you can refer to the suggestions presented in the Audit section to improve your website loading speed.
If you want to know more about Google PageSpeed Insights, this Google article will show you everything you need to know.
Are you still confused about a website’s page speed? Check out our quick video for more details on how you can increase your website’s page speed.